go tool trace
执行跟踪捕获范围广泛的执行事件,例如 goroutine 创建/阻塞/解除阻塞,syscall 进入/退出/阻塞,gc相关事件、堆大小的变化、处理器启动/停止等。能捕获纳秒级精度的时间戳和堆栈跟踪事件。生成的跟踪可以使用 go tool trace trace.out 进行解释。
支持跟踪使用标准测试构建的测试和基准测试包被内置到.go test 中。例如,运行
在当前目录中测试并写入跟踪文件(trace.out)。
查看文档
go doc runtime/trace
import (
	"os"
	"runtime/trace"
	"sync"
)

func main() {
	// trace 代码
	f, err := os.Create("trace.out")
	if err != nil {
		panic(err)
	}
	defer f.Close()
	err = trace.Start(f)
	if err != nil {
		panic(err)
	}
	defer trace.Stop()

	//逻辑代码
	var wg sync.WaitGroup
	for i := 0;i < 20 ;i++ {
		wg.Add(1)
		go func() {
			a := 0

			for i := 0; i < 1e7; i++ {
				a += 1
			}
			wg.Done()
		}()
	}
	wg.Wait()
}
运行会生成 trace.out 文件
go run main.go
trace.out 文件并启动可视化界面:
$ go tool trace trace.out
2020/12/25 12:15:00 Opening browser. Trace viewer is listening on http://127.0.0.1:62349

# 也可指定 http 端口
go tool trace -http="localhost:26666" ./trace.out
通过浏览器访问,主要有以下选项
View trace:查看跟踪,能看到一段时间内 goroutine 的调度执行情况,包括事件触发链;

Goroutine analysis:Goroutine 分析

Network blocking profile:网络阻塞概况

Synchronization blocking profile:同步阻塞概况

Syscall blocking profile:系统调用阻塞概况

Scheduler latency profile:调度延迟概况

User defined tasks:用户自定义任务

User defined regions:用户自定义区域

Minimum mutator utilization:最低 Mutator 利用率
View trace
基于上述,浏览器页面点击 View trace, 查看 goroutine 的调度执行情况。
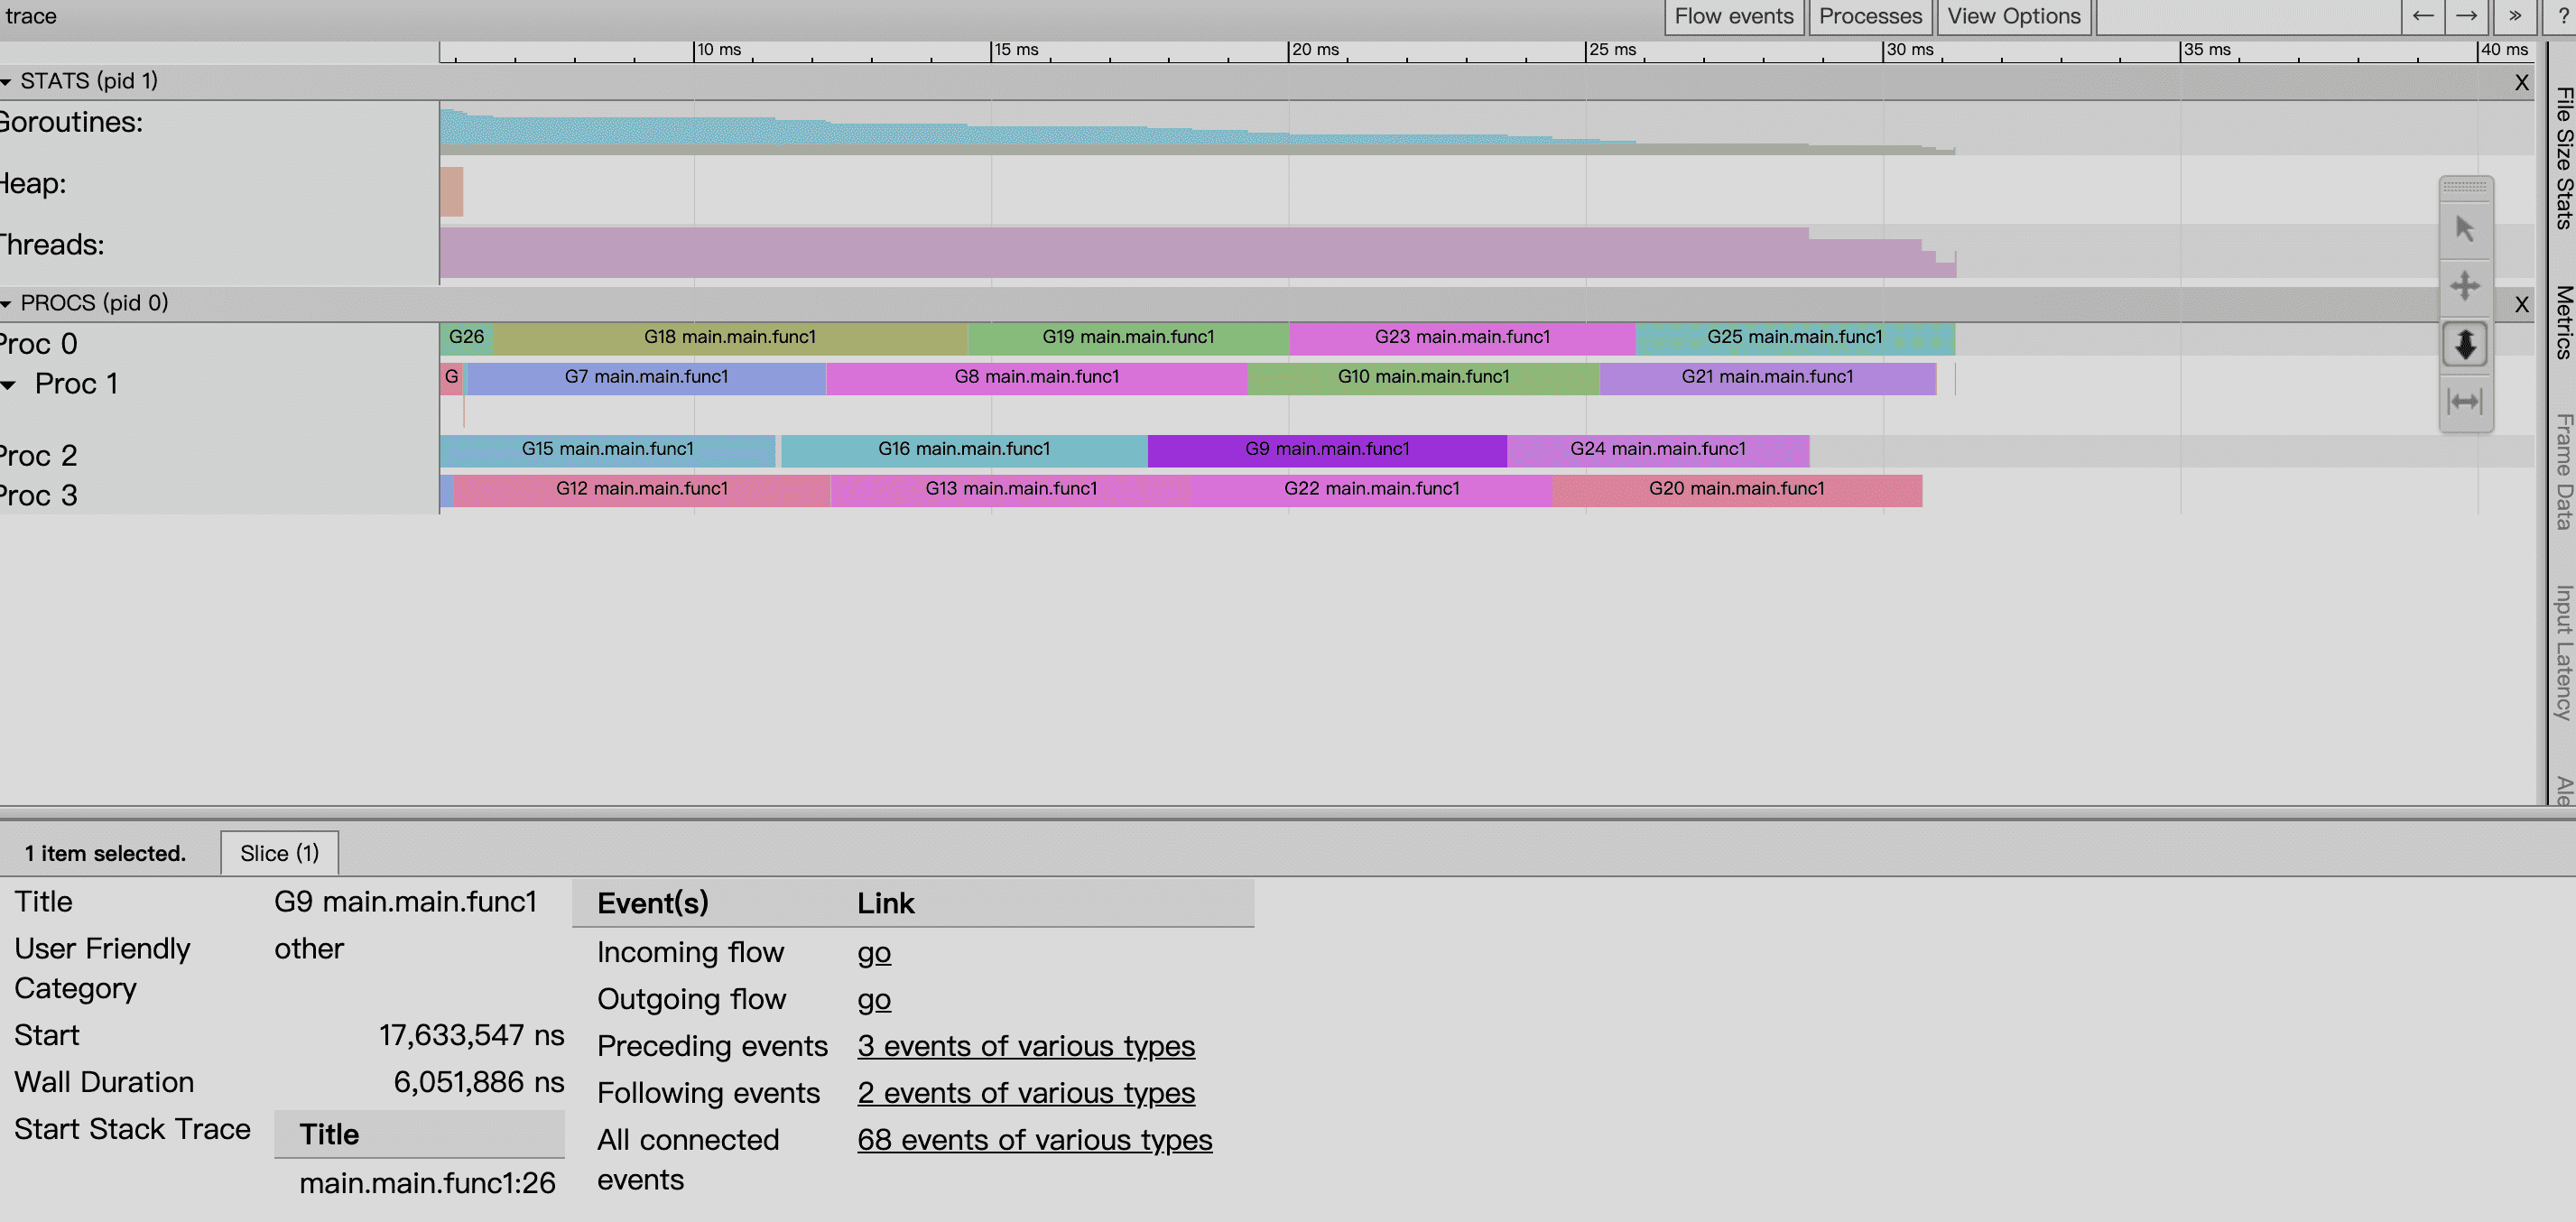
查看 goroutine:
- Start:开始时间(就是时间轴上的刻度)
- Wall Duration:持续时间(这个 goroutine 在这个处理器上连续执行的小段时间)
- Start Stack Trace:协程调用栈(切进来执行的 goroutine 调用栈)
- End Stack Trace:切走时候时候的调用栈
- Incoming flow:触发切入的事件
- Outgoing flow:触发切走的事件
- Preceding events:这个协程相关的之前所有的事件
- Follwing events:这个协程相关的之后所有的事件
- All connected:这个协程相关的所有事件
reference
https://about.sourcegraph.com/go/an-introduction-to-go-tool-trace-rhys-hiltner/